SAFe Advanced Scrum Master certification
SAFe Advanced Scrum Master certification
View my verified achievement from Scaled Agile Inc on Acclaim.
View my verified achievement from Scaled Agile Inc on Acclaim.
Beginning of June I obtained my “DAT202.2x Implementing Real-Time Analytics with Hadoop in Azure HDInsight” certificate from Microsoft by following the course at edx.org. Since there has been lots of new information for me to digest, I have gone through the course once more trying to summarize the most important parts of it. This post is the result of my attempt to create a concise summary of the course. If you need more in-depth information feel free to search for it on the internet; you are sure to find what you will be looking for 🙂.
Preparatory steps
In order to be able to follow along during the course, and successfully complete the lab exercises, you will need to create a free account for Microsoft Azure and also download a few helpful tools. This is all explained at the preparatory steps that precede the first module of the course titled “Using HBase for NoSQL Data”
1. Using HBase for NoSQL Data
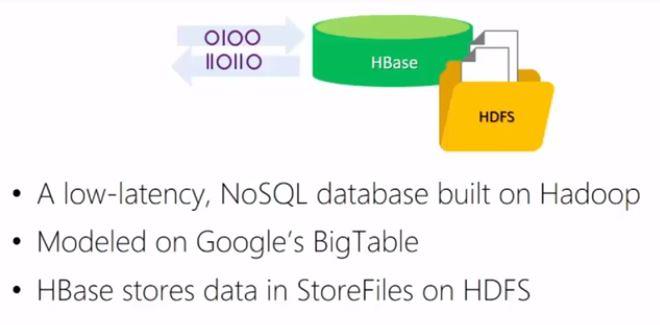
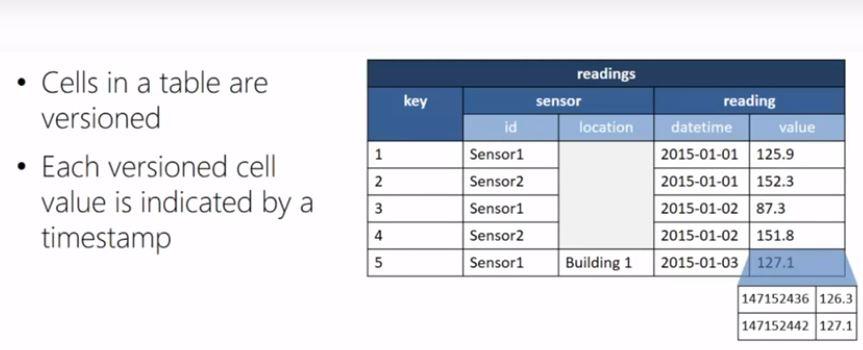
During this module you will learn what HBase is and how it can be used to store and access data. HBase is a low-latency, distributed NoSQL database that uses Hadoop technologies. Within HDInsight you can create an HBase cluster and use the Azure storage. HBase has been modelled after Google’s BigTable aiming to quickly store and retrieve large amounts of data which are stored as files on HDFS. Although the notion of a table is used in HBase, data are stored as key-value pairs with the key identifying a row and the value consisting of multiple columns of data or a single column of data. Within that column might be multiple little bits of data, little entities that you want to find information about.
Every cell in an HBase table is versioned, indicated by a timestamp. You can use the timestamp to get retrieve a specific cell value.
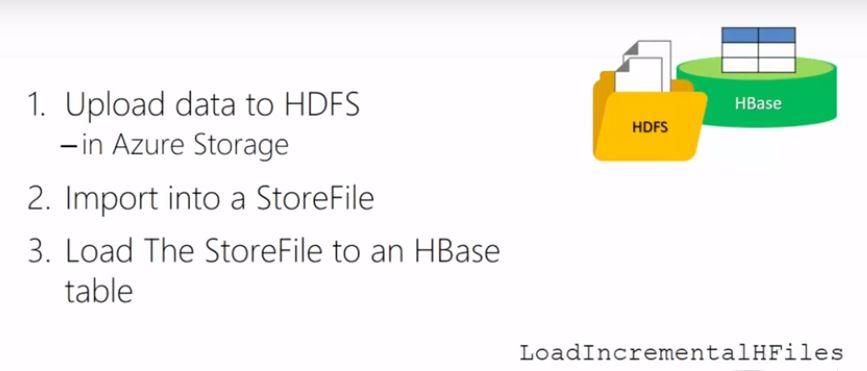
You can insert data to HBase either a cell at a time, or bulk-load using files. In order to use bulk-loading you first have to upload the files to HDFS (Azure storage in case of HDInsight) and consequently transform those files to StoreFiles, before loading the data to HBase.
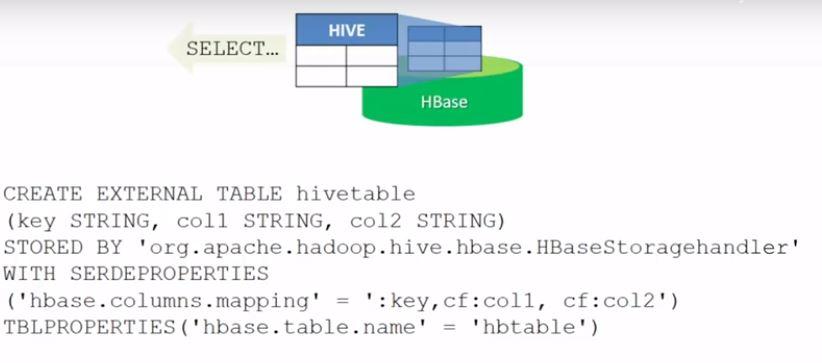
Data in HBase can be accessed directly by using the ‘get’ and ‘scan’ keywords. A more powerful way to do that is to query an HBase table from Hive. For this, a Hive table has to be created on top of the HBase table, along with the mappings between the HBase columns and Hive. Having accomplished that, you can then use HQL to query HBase tables through Hive.
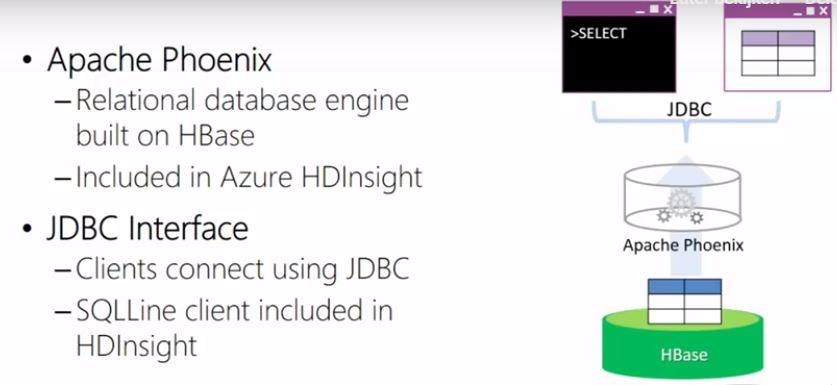
Another way to query HBase data in HDInsight is by using regular SQL through Apache Phoenix. Phoenix is a relational database engine built on top of HBase that uses the JDBC protocol.
2. Using Storm for Streaming Data
This module begins by defining a data stream as an unbounded sequence of event data, or in other words a continuous flow of data without an end. When processing streams, aggregation would most probably find place during a meaningful temporal window.
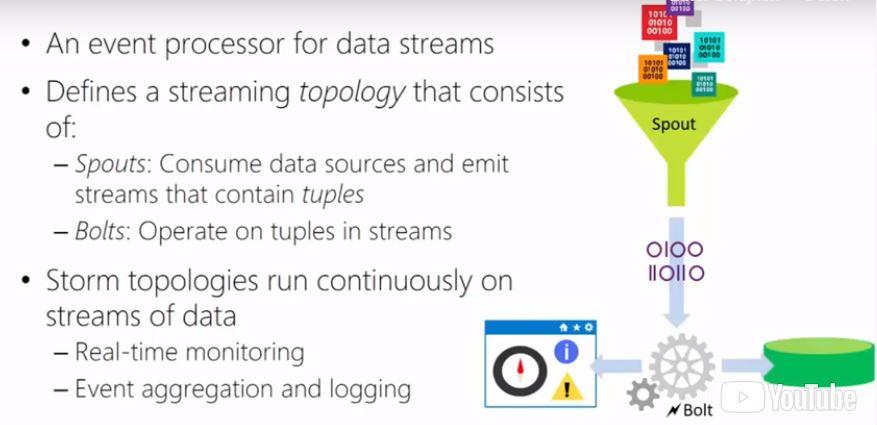
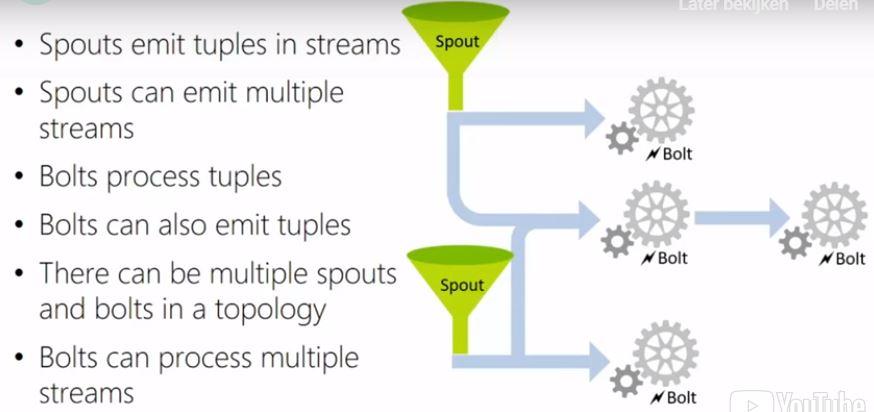
Storm is an open source Apache project that provides an event processor for data streams and employs the concept of topologies. You can implement a Storm topology by using Spouts and Bolts. A Spout consumes data streams and emits tuples of data to be consumed by one ore more Bolts. A Bolt contains the logic to be applied to the data tuples. A Storm topology can be used to process real-time data for different purposes such as real-time monitoring and reporting or simply in order to populate an HBase table.
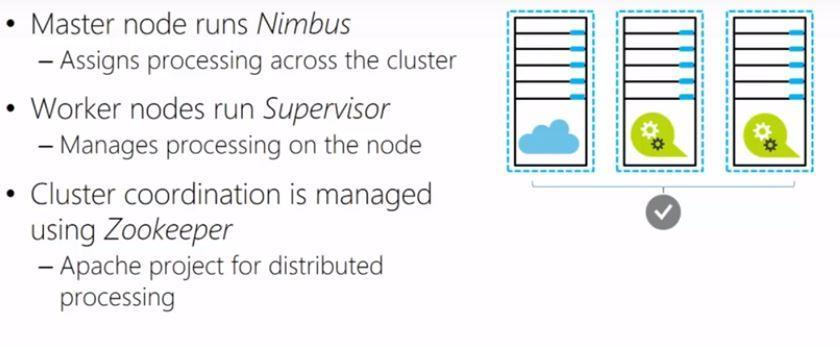
Within HDInsight you can create Storm clusters. Such a cluster consists of a master node running Nimbus and worker nodes running Supervisor. Nimbus assigns the processing tasks to the worker nodes, Supervisor manages the processing on the particular worker node, while Zookeeper takes responsibility of the overall management of the distributed processing. Zookeeper is again an Apache project that fits to the Hadoop ecosystem and is generic in nature, in the sense that it is not specific to Storm.
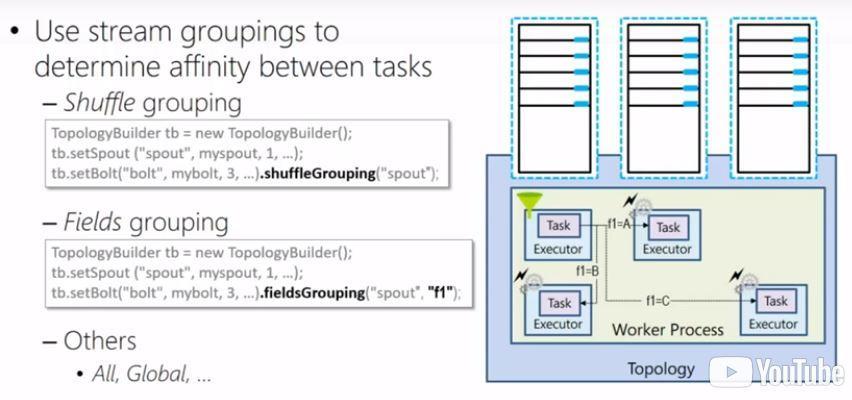
When a Storm topology is submitted for execution to the Storm cluster, you can benefit from parallelism. In the simple example shown below, where there is one worker process with two tasks (one spout and one bolt) you can set the parallelism hint to create more instances of any task. In this example, 3 instances of the bolt task have been created. As you can also see, each task is residing within an executor.
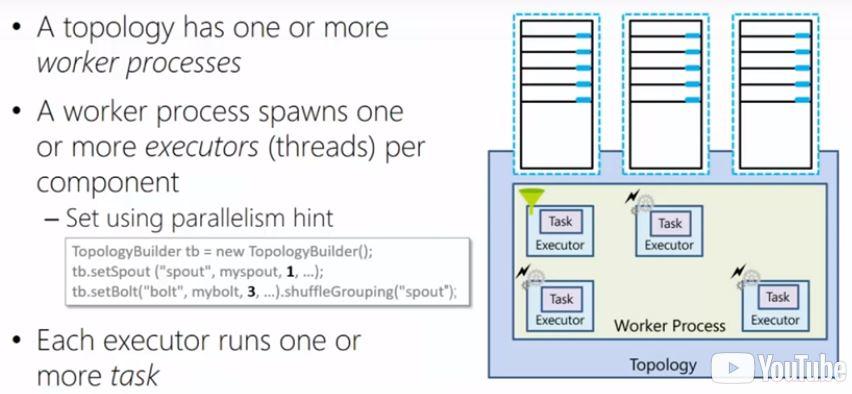
By looking closely at the image above you will notice the shuffleGrouping class. By using grouping in Storm, you can determine the way that tuples are being distributed over the respective tasks. In the example above the tuples will be evenly distributed among the 3 bolt tasks. You can also choose for fieldGrouping that will distribute the tuples to executors according to the value of a certain field. Although there are more kinds of groupings you could use, shuffleGrouping en fieldGrouping are the most common ones.
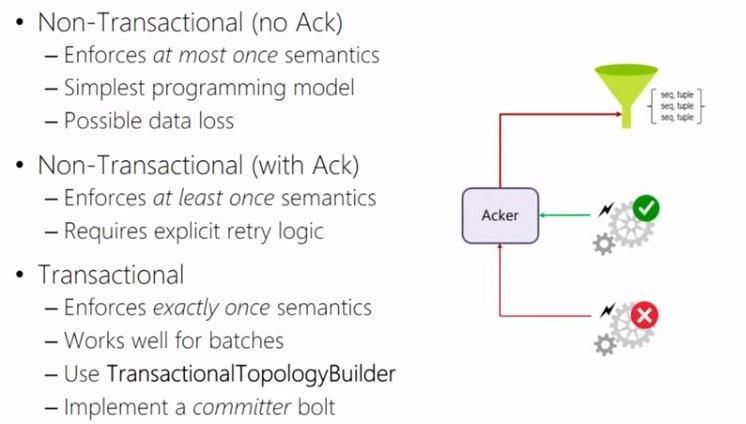
A Storm topology has a set of specific tasks, called Ackers, by which you can track the processing status of a tuple. In order for this to work you will need to cache and uniquely stamp each tuple at the spout. By using the Acker after each bolt, you will either send a ‘success’ or ‘fail’ message to the Spout depending on whether the tuple has been successfully processed or not. The retry logic (which tuples will have to be re-processed by which bolts) will have to be manually created and thus requires explicit programming. Another different class of topologies is the transactional Storm topology, where re-sending of tuples in case of failure happens automatically and a commiter bolt has to be used at the end of the topology.
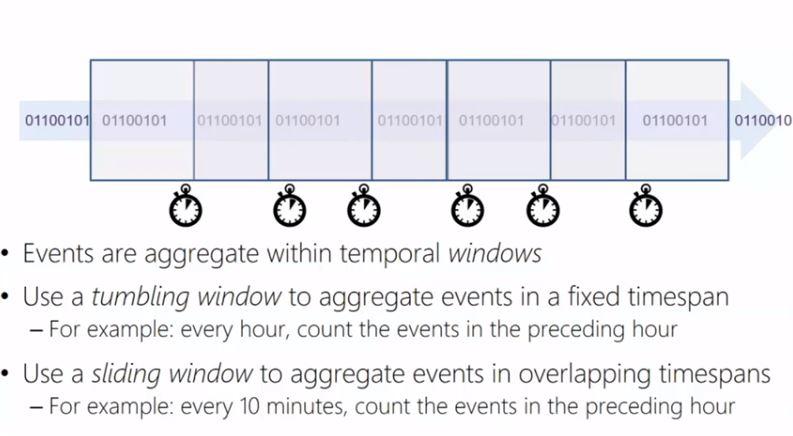
As it has already been mentioned a common operation on streams of data will be aggregation. The two most common aggregation types are tumbling window and sliding window aggregation. When talking about a tumbling window aggregation we refer to aggregating events in a fixed timespan, while a sliding window refers to aggregating events in overlapping timespans.
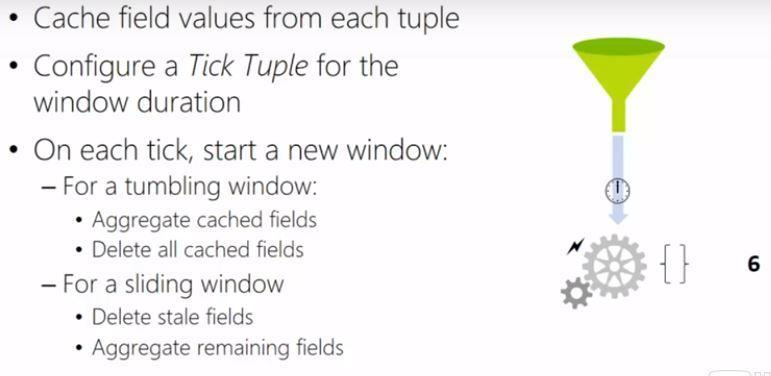
In order to implement aggregation in Storm you will have to cache the incoming tuples at the aggregation bolt and act on those based on a Tick tuple. A Tick tuple is a special kind of tuple that you can configure within Storm and that whenever it is being sent from the spout it will initiate the aggregation logic.
3. Using Spark for Interactive Analysis
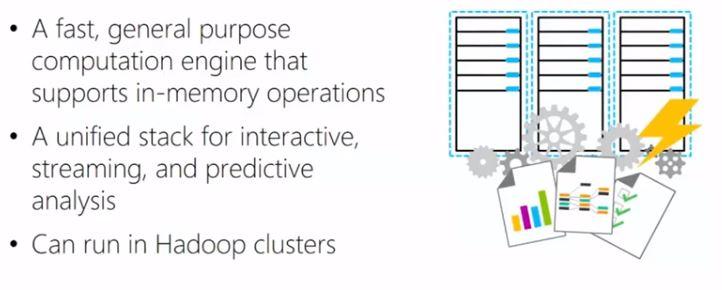
Spark is designed as a fast, general purpose computation engine that supports in-memory operations. While not everything in Spark is necessarily in-memory, it is much faster than Pig and Hive, both of which do not support interactive data analysis. Since Spark is a general purpose engine, it can be used for different use -cases such as streaming, interactive and predictive analysis. As you might have expected, Spark is supported in HDInsight in the form of a different type of cluster that you can create.
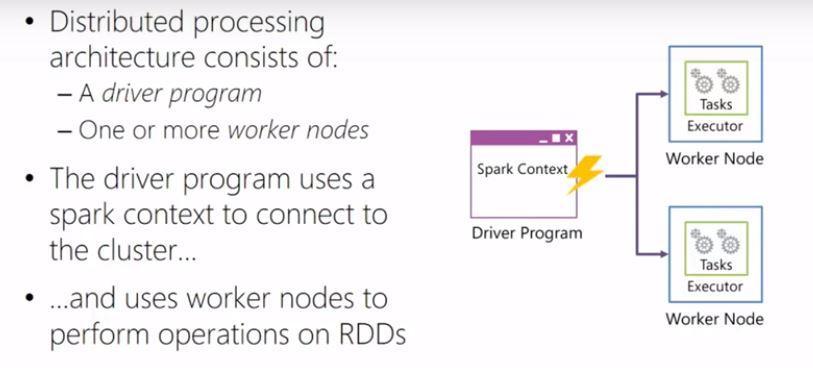
The building block of Spark is the resilient distributed dataset (RDD) which is a collection of items. There are different APIs to work with RDDs. HDInsight supports Python and Scala, although you can also program in Java. In order to work with Spark you will need the Driver program that will use the Spark Context to connect to the master node of the cluster and one or more worker nodes to perform the processing. The Driver program initiates all Spark processing.
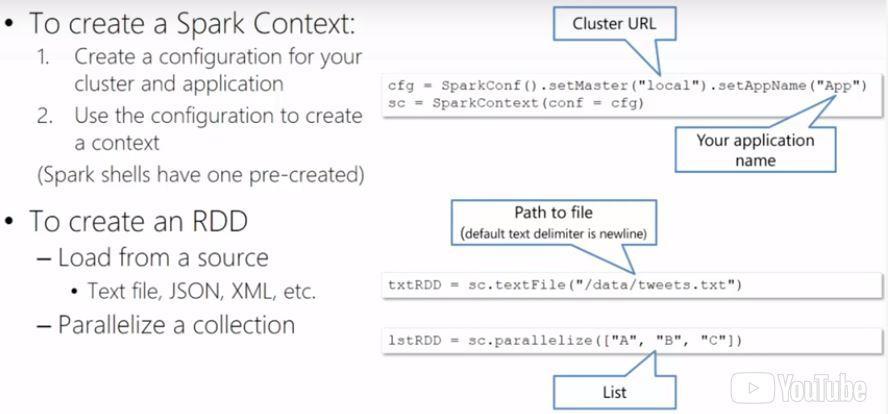
The image below shows how to create a Spark context and an RDD.
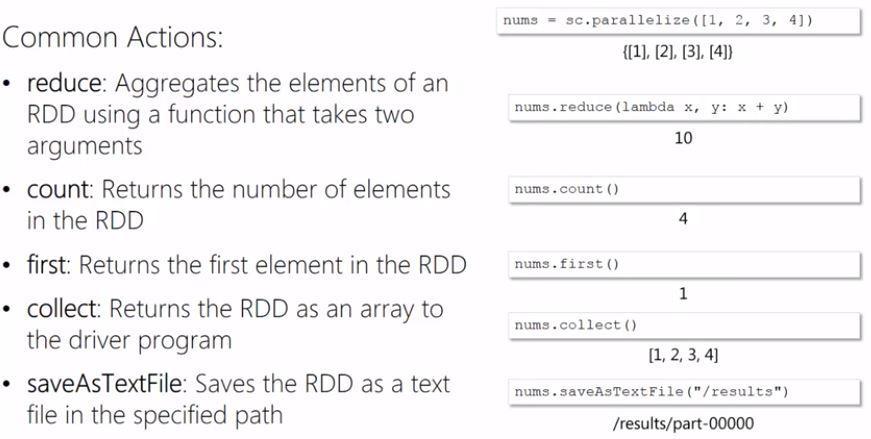
With RDDs you can call transformations that will create a new RDD or actions to output results. The most common are shown below.
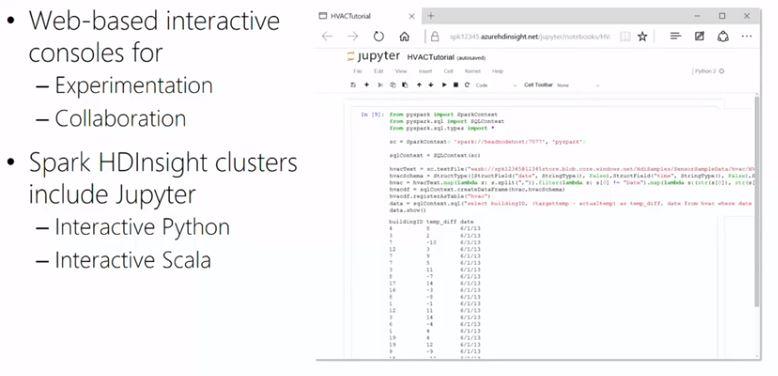
In order to work with Spark you can of course create your own standalone application in Java or Python. If you want to work interactively with the data, you can use Notebooks at a web browser. The Notebooks used at HDInsight are based on Jupyter, which is a notebook format widely used in Data Science
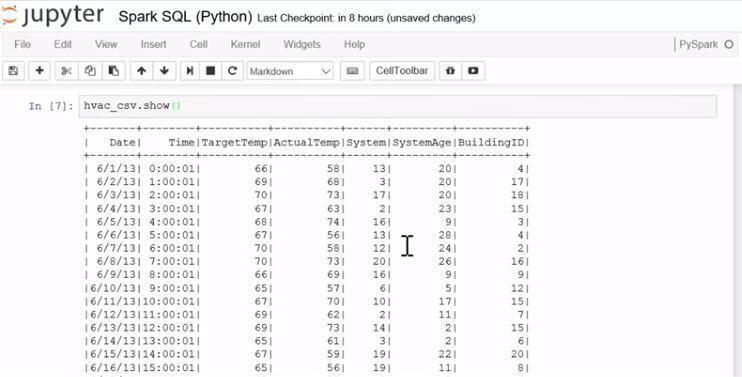
A more recent addition to Spark is the DataFrames. By using DataFrames you can structure the data so that they can be queried with Spark SQL. The schema for a DataFrame can either be declared beforehand or be inferred at runtime, with explicit declaration being the preferred method so as to not negatively impact performance. DataFrames can be persisted as shared tables or temporary views and be queried along with Hive tables by using Spark SQL.
The final concept on Spark that this course talks about is Spark streaming. This is a concept similar to Storm streaming, that is specific to Spark. It operates on RDDs by handling the incoming stream as a sequence of RDDs, thus creating discretized streams or DStreams.
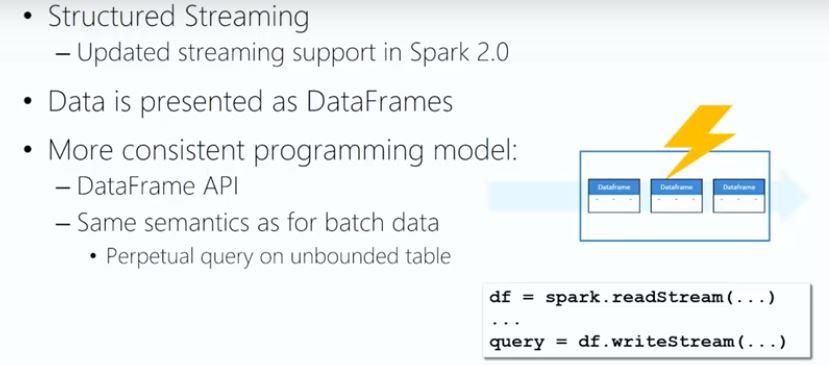
In Spark 2.0, when streaming data, the concept of RDD is replaced with DataFrames so that you will be using the same concepts when working with data at rest as with streaming data.
4. Introducing Kafka
Kafka is offered as a preview at this course. HDInsight offers Kafka clusters by which you can store messages in topics. Data stored in Kafka is produced by a producer and consumed by a consumer. Kafka will take care of storing these messages and properly prepare them for processing by the respective consumer. Kafka can be combined, for instance, with Spark streaming if both clusters are in the same virtual network in order to build complete Big Data solutions.
End of May I obtained my “DAT202.1x – Processing Big Data with Hadoop in Azure HDInsight” certificate from Microsoft by following the course at edx,org. Since there has been lots of new information for me to digest, I have gone through the course once more trying to summarize the most important parts of it. This post is the result of my attempt to create a concise summary of the course. If you need more in-depth information feel free to search for it on the internet; you are sure to find what you will be looking for 🙂.
Preparatory steps
In order to be able to follow along during the course, you will need to create a free account for Microsoft Azure and also download a few helpful tools. This is all explained at the preparatory steps that precede the first module of the course titled “Getting started with HDInsight”
1. Getting started with HDInsight
During this module you will learn what Big Data, MapReduce, Hadoop and HDInsight is and you will get familiarized with setting up an HDInsight cluster in Azure. You will also get to run MapReduce jobs and use Powershell and the client tools in order to interact with the cluster you have created.
The first thing that stroke me was the wealth of the resources you can choose from at the Azure portal.
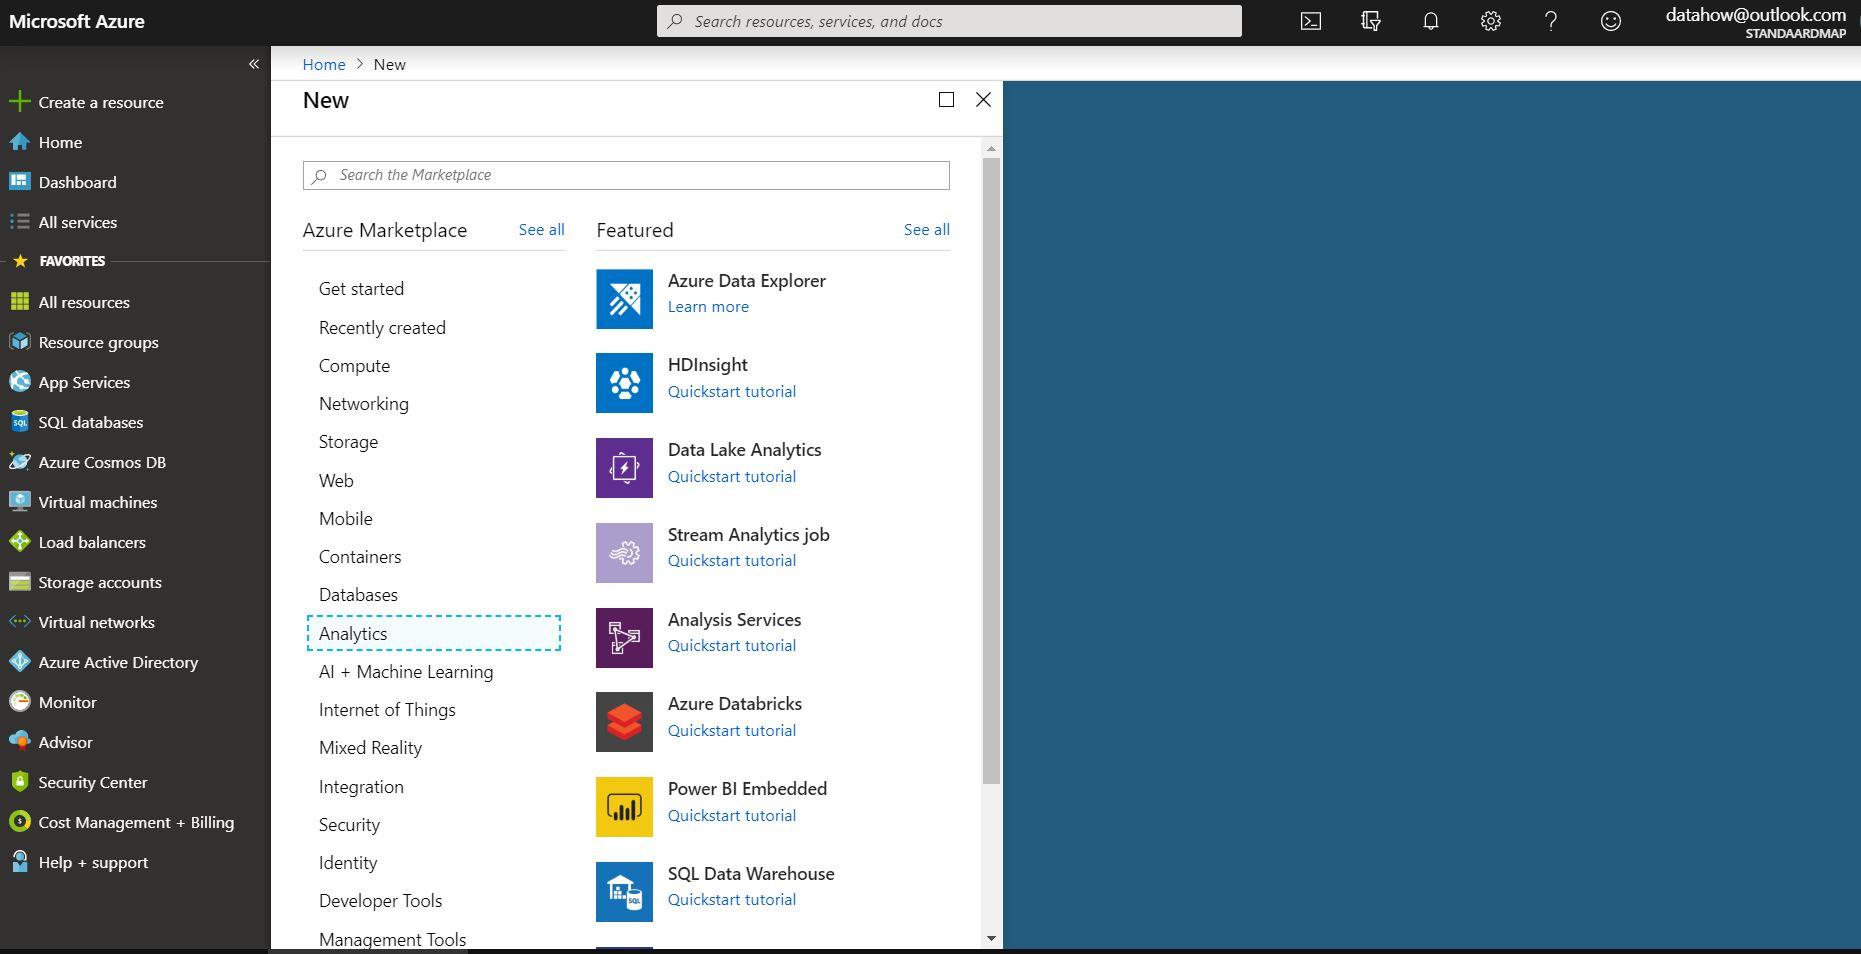
Secondly, I liked the user interface a lot, with the different slates opening to the right
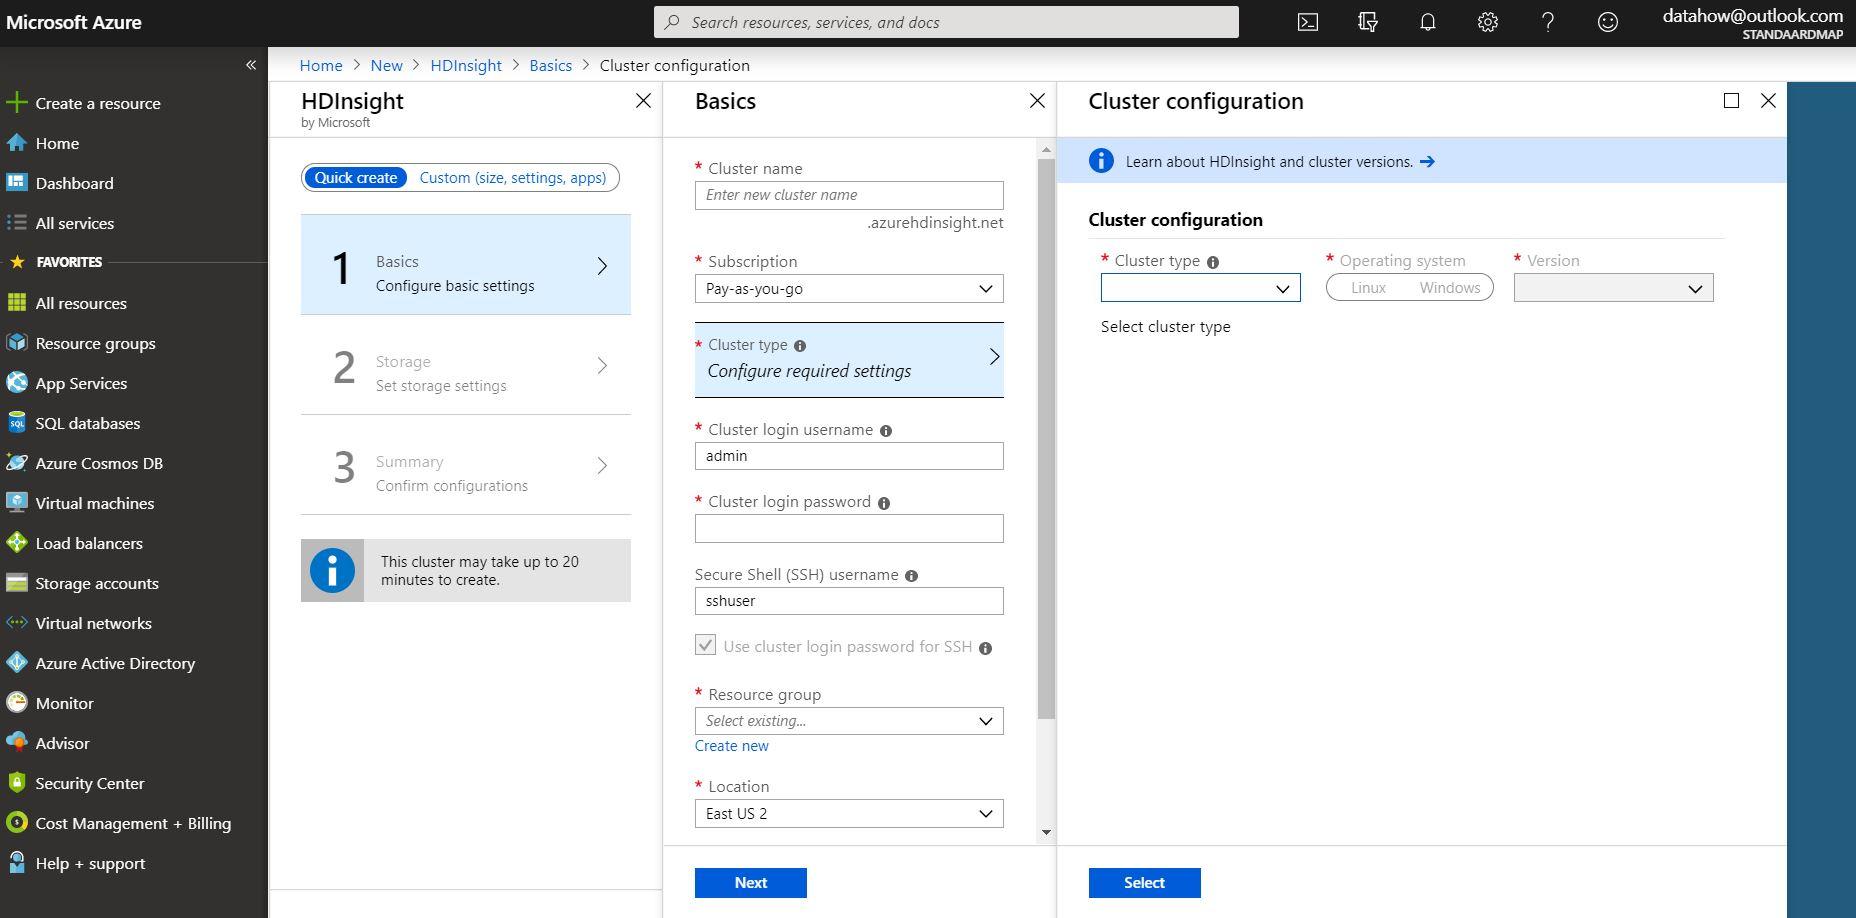
Although creating a new resource is quite easy, the different options you are presented with are somewhat overwhelming. And you should also not forget to delete the cluster you have created if you don’t what to use it anymore, otherwise your credit card will be charged even though your cluster might not de processing any data. Thankfully you do get some free credits with your account in order to start experimenting.
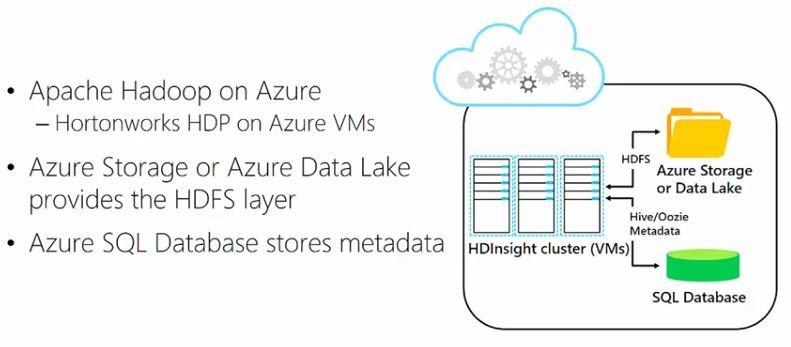
HDInsight is, simply put, open-source Hadoop running on Azure, more specifically, a Hortonworks (and after the merger a Cloudera) implementation of Hadoop running on virtual machines. In HDInsight though, HDFS is implemented differently. The storage is not managed by the actual hard disks connected to the virtual machines, but it is moved into the cloud, into either the Azure storage blob or into the Azure data lake. Beacuse of that, if you don’t need the cluster, you can take it down and still keep the data.
2. Processing Big Data with Hive
Hive projects a schema on text files making them behave like database tables, which means that you can execute SQL-like queries against those files. Hive organises the underlying data in folders that reside on HDFS and contain text files.
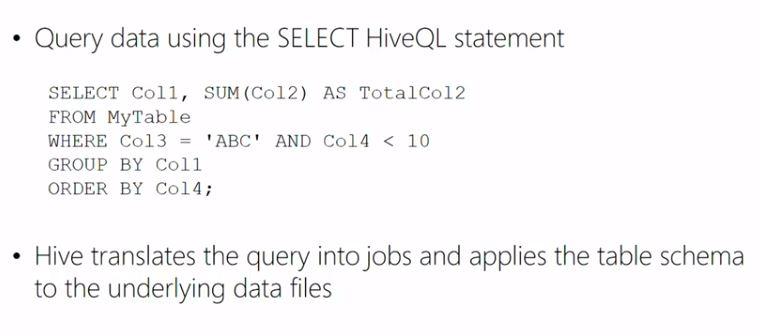
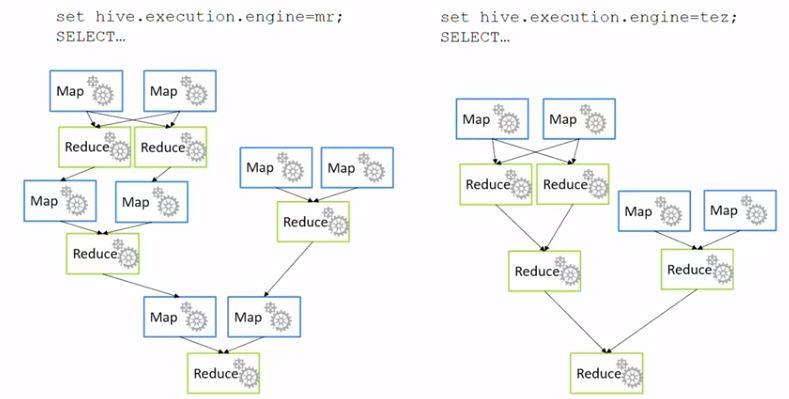
Although Hive executes MapReduce jobs, it does not necessarily use the MapReduce engine. Nowadays, making use of the Tez engine results in beter performance as Tez omits unnecessary Map jobs. This is something you don’t have to worry about though, as it is all getting taken care of by Azure.
By executing consecutive Hive queries against those files, you can perform batch operations in order to clean, transform and process the data, getting them to a usable format and possibly storing them in a database or creating a report with, for instance, PowerBI or even Excel.
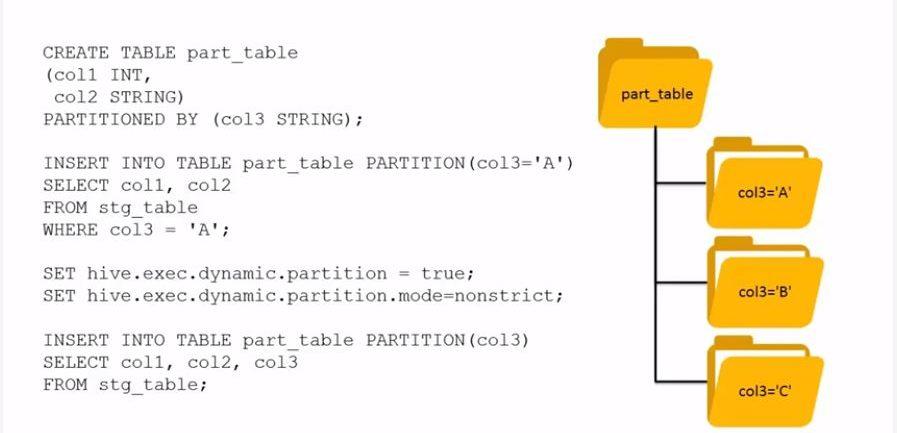
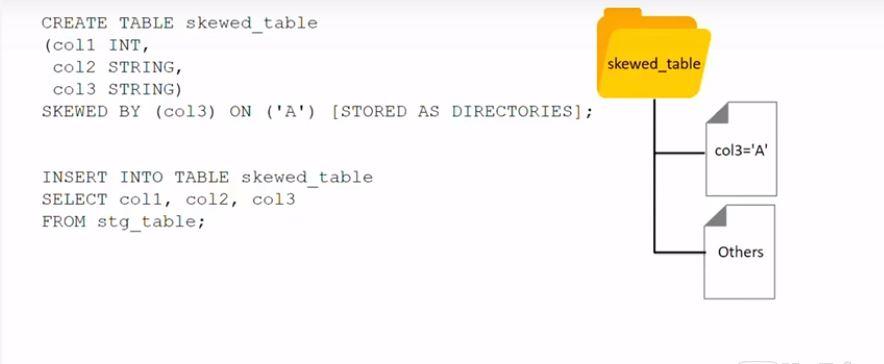
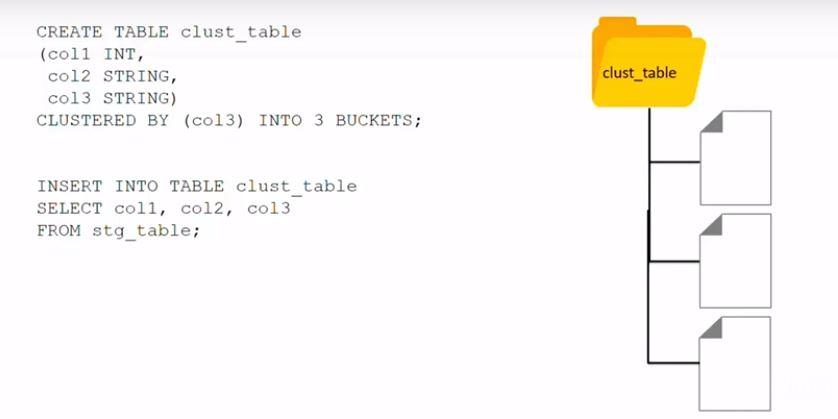
Since Hive is a technology by which large amounts of data can be processed, performance optimization is of paramount importance. Partitioning, skewing and clustering are three techniques that can be used to optimize the performance.
3. Going beyond Hive with Pig and Python
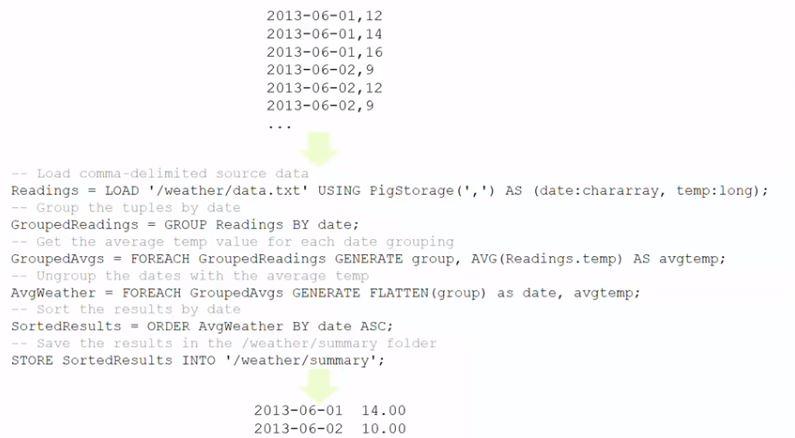
Executing consecutive queries with Hive is fine, but Pig and the respective scripting language Pig Latin might be preferable if you need to perform a series of data operations.
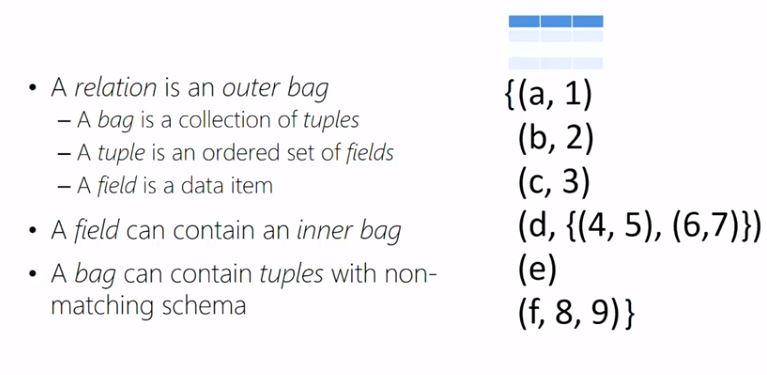
Pig operates on relations. You will have to write Pig Latin statements that will create these relations from the source data and then you can create the second relation from the first relation, the third relation from the second relation and so forth, each time transforming the data until you get them into the structure and shape that you wanted them to be.
Just as with Hive, the relations are loaded using a schema that is projecting a table structure at runtime. Again, similarly to Hive, data that do not fit to the defined schema will be replaced by NULLs. There are lots of different Pig operations that can be applied to the data, however the Tez or MapReduce engine will be called only by calling either the DUMP or STORE operation.
If you need to perform custom data processing, then you can use Python in order to write User Defined Functions (UDFs) since Python is a simple and straighforward scripting language that is natively supported in Azure. You could also alternatively use Java or any other language like, for instance, C#. You could also use Java or .Net to write your own MapReduce jobs, which will be more complicated.
Hive uses UDF’s by Hive streaming, while Pig uses UDFs by employing Jython, which is a Java implementation of Python.
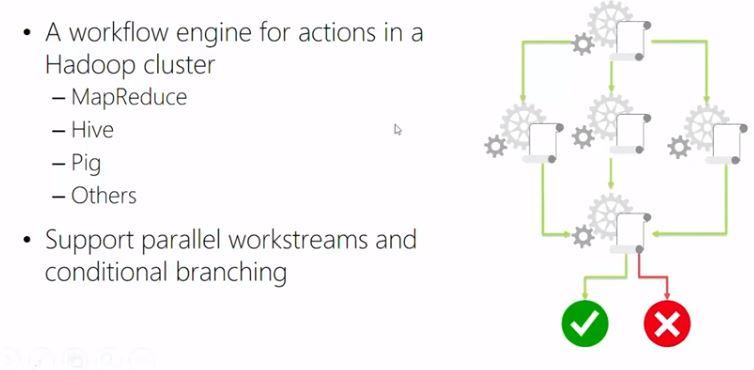
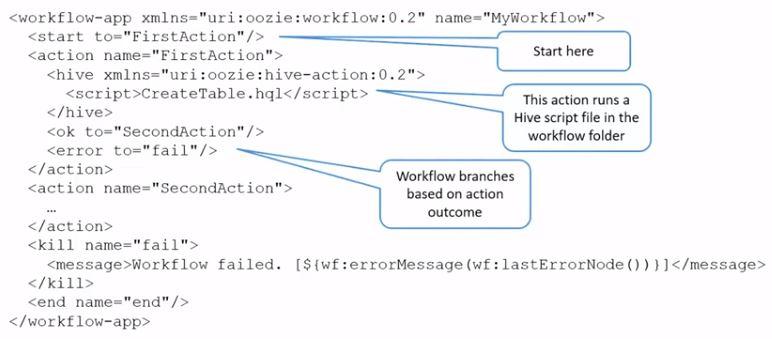
4. Building a Big Data workflow
In typical Big Data processing scenarios you will need to combine different technologies, for example you might need to run a Pig job and then a Hive job or you might need to run a MapReduce job or lots of different processing steps in order to get that data into the structure that you need. This can be achieved by using Oozie. Oozie uses an XML workflow file that defines the actions and process and together with that there will be some scripts running the actions. You could write your own application in your prefered programming language that will call Oozie or Hive or Pig jobs in order to perfrom the necessary tasks. If you need to transfer data to and from relational databases, you can use a technology named Sqoop.
In addition to the theory, there will be lots of lab exercises for you to practice and assessment to test your knowledge and earn your certification.
Theme of the day was “Be curious” so I felt I had to attend 🙂. Interesting to see which direction SAS will be moving with their products and I’m curious how they will be balancing “choice” and “control”. Beautiful set up and an excellent idea to use live translation for non-Dutch speakers. Thanks SAS and sponsors for this event.
There is still so much to learn that there is no excuse for not keeping improving one’s knowledge. Passed the “Implementing Real-Time Analytics with Hadoop in Azure HDInsight”