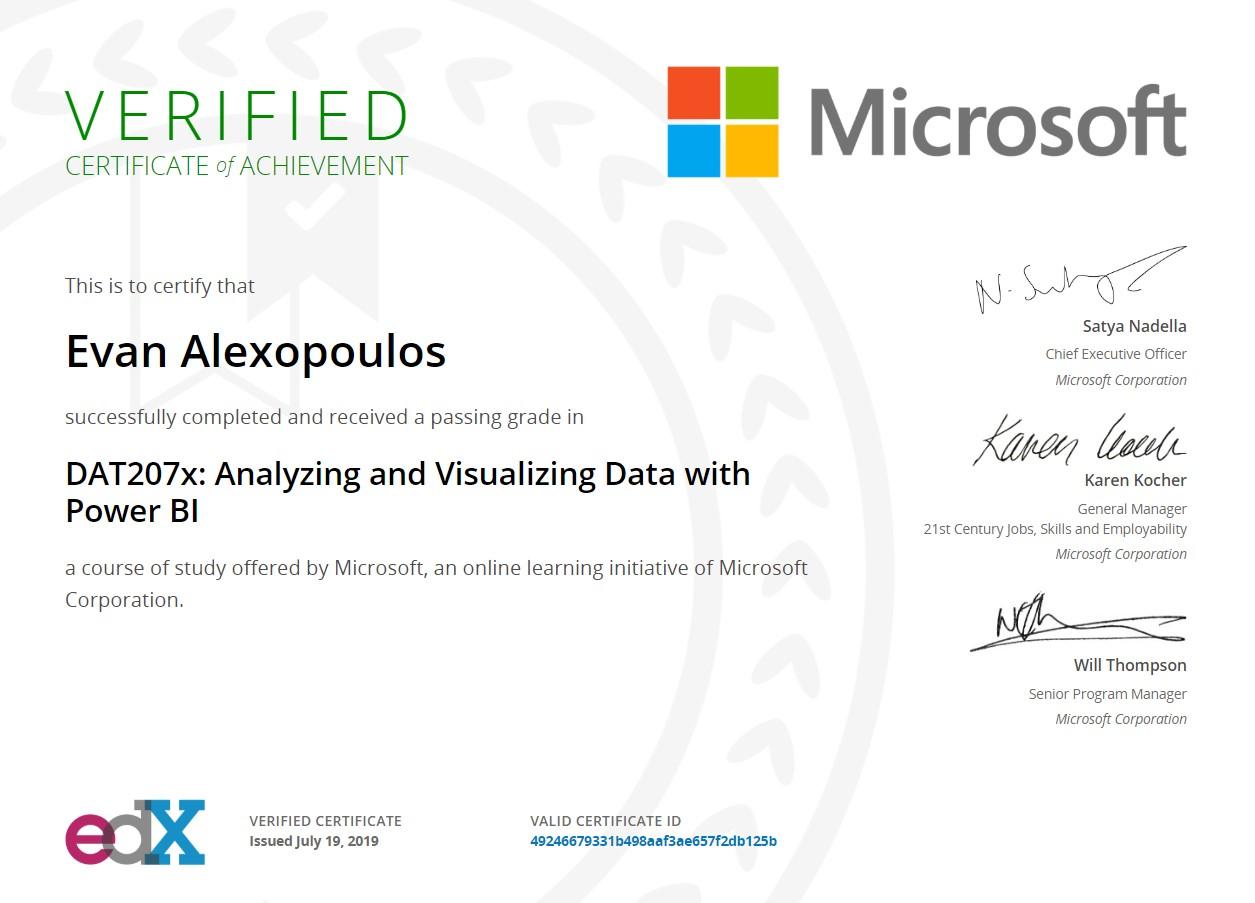
Completed the “DAT207x: Analyzing and Visualizing Data with Power BI” course and passed the exam!
Completed the “DAT207x: Analyzing and Visualizing Data with Power BI” course and passed the exam!
I have just completed the “Analyzing and Visualizing Data with Power BI” course! Here is what I liked and what I disliked regarding the tool and the course itself.
Liked:
Power BI is a very intuitive tool, following the Microsoft Office UI. It is powerful and fast in data preparation, using lots of useful built-in transformations like unpivoting data. The DAX language helps developers to create dashboards faster with Excel-like functions such as TOTALYTD, CALCULATE and SAMEPERIODLASTYEAR. There is out-of-the-box connectivity to popular resources such as Salesforce and you will also get suggestions, called insights, based on data sources you connect to it, jump-starting dashboard creation. Power BI offers forecasting and clustering in an easy to use manner and can be further extended by using Python, R and custom visualizations, fully integrated within the tool. Finally, Power BI can be embedded within other applications, using the available SDK and APIs.
I liked this course because of the hands-on labs and assignments that are mandatory in order to get the certificate. I got the chance to experiment with Power BI and the data provided at the course and got to love the tool even more.
Disliked:
What I did not like about the tool is that although it is strong in self-service analytics, it lacks functionality needed for data governance and scheduled, distributed reports. Moreover, it does not support role-based authentication. You can, of course, combine Power BI with different Microsoft components (i.e. SSRS for role-based authentication) in order to achieve the necessary functionality but this is not ideal as it adds to the different (Microsoft) tools that need to get implemented. Finally, you will have to use Azure Cloud if you want to implement Power BI as a cloud solution, as there is no alternative IaaS offering to Azure. Therefore, choosing Power BI will mean that you are implicitly going for the Microsoft stack and that’s something to be aware of!


